Nursery crops again top list of Oregon’s most valuable ag commodities
Published 5:00 pm Tuesday, October 12, 2021
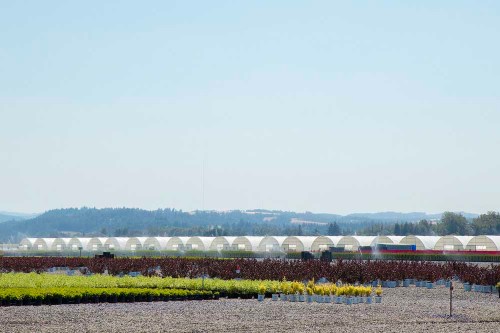
- Greenhouse and nursery crops are this year’s top agricultural crop in Oregon.
PORTLAND — When it comes to ranking Oregon’s most valuable agricultural commodities, the greenhouse and nursery industry remains king.
The state Department of Agriculture has released its annual list of top 20 crops by value of production for 2020, with greenhouse and nursery products leading the way at $1.18 billion.
Cattle and calves placed a distant second at $587.8 million, and third was hay at $569.1 million.
Rounding out the top 10, in order, are milk, grass seed, wheat, potatoes, winegrapes, cherries and hazelnuts.
Data for the rankings comes primarily from the USDA National Agricultural Statistics Service. Other industry estimates are also provided by ODA, Oregon State University, the Oregon Department of Fish and Wildlife and the Oregon Wine Board.
For Oregon’s greenhouses and nurseries, 2020 marked the second straight year with at least $1 billion in sales.
Jeff Stone, executive director of the Oregon Association of Nurseries, said getting to this point was a long time coming after the industry was ravaged by the Great Recession in 2008. The housing crisis and declining consumer confidence created what Stone described as “a perfect storm of economic calamity” for the industry.
“We lost one-third of the nurseries in the state,” Stone said. “We saw really good nurseries that had not made poor business decisions evaporate, because there was no market.”
In 2019, ODA initially valued greenhouse and nursery production at $955.1 million before revising that estimate to $1.06 billion. Last year saw another 11% increase, which Stone said was due in part to greater interest in gardening and home improvement projects during the pandemic lockdown.
“In a twist of circumstance, the pandemic and people being marooned at home really reacquainted them with plants and working out in their yards,” he said.
Hay and cattle swapped places in the 2020 rankings, though both saw declines in value from 2019 of approximately 16% and 6%, respectively. Overall, hay production was down by 386,000 tons while the inventory of cattle and calves was down by 30,000 head, according to USDA figures.
Just cracking Oregon’s top 10 commodities were cherries and hazelnuts, which saw significant gains in 2020.
Cherries increased 78% in value over 2019, bolstered by high demand and higher prices for growers. Hazelnuts also had a record year in 2020, with growers harvesting 63,000 tons of nuts compared to 43,000 tons in 2019, translating to a 57% increase in the crop’s value.
Eggs, onions, potatoes, sweet corn, Dungeness crab, hops, Christmas trees, apples and milk all saw their value of production increase as well, ranging from 1% to 29%.
“This is the best kind of arms race there is, when this list comes out,” Stone said. “We want everybody to have a better year.”
The list does not include industrial hemp, though Dave Losh, state statistician for USDA-NASS in Portland, said the agency plans to mail its first hemp acreage and production survey later this month, with results published by next February.
”It’s great that both production and value is up for a lot of the commodities,” Losh said. “I think that certainly speaks to the demand of quality products that Oregon produces.”
While the total farm gate value of agricultural goods in Oregon eclipsed $5 billion for the first time in 2017, Losh said the cost of production for growers is rising at least as fast. Farm expenses in Oregon totaled $4.7 billion in the 2017 USDA Census of Agriculture, about $1 billion of which was tied to labor.
The Oregon Department of Agriculture and USDA National Agricultural Statistics Service have compiled the state’s top 20 agricultural commodities by value for 2020.
- Greenhouse and nursery — $1.18 billion.
- Cattle and calves — $587.8 million
- Hay — $569.1 million.
- Milk — $557.3 million.
- Grass seed — $458.3 million.
- Wheat — $273.7 million.
- Potatoes — $216.8 million.
- Winegrapes — $157.9 million.
- Cherries — $133.8 million.
- Hazelnuts — $132.3 million.
- Blueberries — $119.6 million.
- Onions — $118.6 million.
- Christmas trees — $106.9 million.
- Pears — $97.5 million.
- Corn, grain — $77.5 million.
- Hops — $74.8 million.
- Eggs — $72.9 million.
- Dungeness crab — $72.6 million.
- Sweet corn — $41 million.
- Apples — $39.2 million.


-
eEdition

-

-